Using ChatGPT for data analysis might sound like a recent innovation, but the idea is simple: combine conversational AI with smart querying to get structured insights from your data. It doesn’t replace spreadsheets or statistical tools. Still, it does remove some of the friction—especially when you need quick insights, plain-language explanations, or a clean summary of patterns you’re spotting on your own. If you’ve been staring at your dataset with more questions than answers, ChatGPT can help you ask smarter ones.
This isn’t about magic. It’s about asking well-formed questions and giving the model the right context. Here’s how to get started without the jargon and without spinning your wheels.
How to Generate Data Analysis with ChatGPT
Step 1: Prep Your Dataset Beforehand
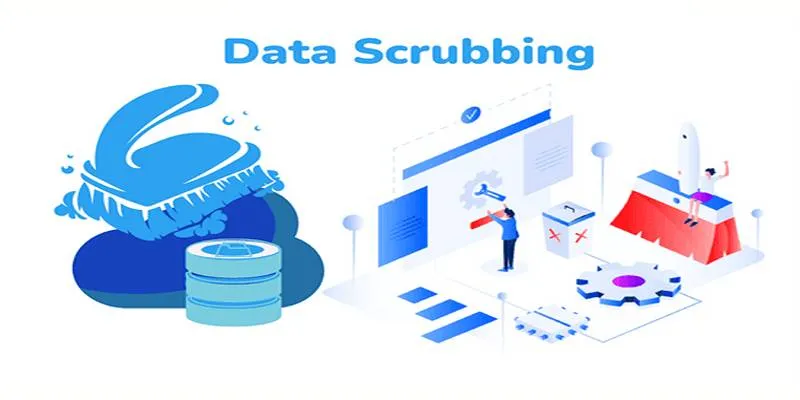
Before using ChatGPT, ensure your dataset is ready. This might sound like a no-brainer, but the model works best when it’s not guessing what’s missing. Clean, labeled data allows ChatGPT to focus on analysis instead of filtering out chaos.

Keep these basics in check:
- Remove duplicates – They skew the patterns.
- Handle missing values – Either drop the incomplete rows or fill them in sensibly.
- Label your columns clearly – “Date,” “Sales,” and “Location” make more sense than “A,” “B,” and “C.”
- Use consistent formats, especially for dates and numerical values.
If your dataset is stored in a spreadsheet, save it as a CSV file. That way, you can upload it easily when prompted.
Step 2: Start with Clear Prompts
Once your data is prepped, your next step is to give ChatGPT a clear idea of what you want. Being vague results in broad summaries that don’t say much. Instead of asking, “What can you tell me about this data?” consider something more specific, like:
- “Can you identify any trends in monthly sales?”
- “Are there any outliers in this dataset?”
- “What are the top-performing regions based on revenue?”
Here’s where you give it direction. If you want visual summaries, ask for a chart. If you need clustering, ask for groupings. The model responds well when the goal is clear from the start.
Step 3: Upload and Analyze
When using a version of ChatGPT that allows file uploads, the process becomes much smoother. Just upload your CSV file directly and guide the model through what you want. ChatGPT can read the file, run statistical summaries, generate plots, and even point out data integrity issues.
Some useful prompt formats include:
- “Read this CSV file and give me a summary of the main patterns.”
- “Which products have the highest average monthly revenue?”
- “Please group this data by customer segment and calculate the average purchase value.”
It’s not just about getting the mean or median. You can go further:
- Detect anomalies
- Compare periods
- Create pivot-style summaries
- Identify seasonality in trends
If you’re using the Python-enabled version, you can even generate and run code. For example:
“Write a Python script to group this data by quarter and plot the revenue trends.”
ChatGPT will return the code, run it, and provide the output right there. You don’t need to hop between Jupyter and your data — it’s all in one place.
Step 4: Ask for Visuals (and Know What to Do With Them)
Patterns jump out when they’re visual. Text summaries have their place, but nothing replaces a well-drawn chart. You can ask ChatGPT to generate visuals like:
- Line plots for trends over time
- Bar charts for comparisons
- Histograms for distributions
- Pie charts (though use them sparingly—they’re not great for detailed comparisons)
Here’s a practical way to approach it:
- “Can you plot sales over time by region?”
- “Show me a histogram of customer purchase frequency.”
- “Create a bar chart comparing revenue by product category.”
The model will return a chart directly (if tools are enabled), or it will generate the code you can run on your end. And these aren’t just for presentation—they help you spot patterns you may not have noticed in raw numbers.
One helpful touch: ask ChatGPT to explain the chart it created. Sometimes, the insights that seem obvious in the plot aren’t as clear in the data table, and the model’s explanation often puts those dots together.
Step 5: Use It for What-If Scenarios
Once you’ve done the initial analysis, you can use ChatGPT to test assumptions. Let’s say you found that your revenue dips every third quarter. What happens if you change the marketing spend? Or offer a discount during that period? You can build hypothetical data and ask ChatGPT to project outcomes.

Example prompts:
- “If we increase sales by 15% in Q3, what would that do to the yearly revenue?”
- “Simulate customer churn if we raise prices by 10%.”
- “Estimate how profits would change if overhead dropped by 20%.”
These aren’t bulletproof forecasts, but they’re a fast way to test ideas and identify weak links.
Step 6: Save Time with Quick Summaries
This might sound simple, but it’s one of the strongest features: summarization. ChatGPT can take a messy dataset and condense it into a paragraph of insights. It’s especially useful if you’re reporting to stakeholders who don’t want numbers—just meaning.
Try these:
- “Give me a summary of key takeaways from this dataset.”
- “Explain this data to someone without a background in analytics.”
- “What stands out most about these customer behavior trends?”
This kind of summarization saves hours, especially when you’re trying to prep reports, decks, or executive overviews.
Final Thoughts
You don’t need to be a data scientist to work through a dataset anymore. You need to be curious, clear, and willing to experiment. ChatGPT can help you clean data, explore patterns, generate charts, and write up insights—all in one place. The key is asking it the right way.
Sure, it won’t catch every nuance or replace human interpretation, but it shortens the gap between data and understanding. And for most people, that’s exactly the boost they need. Keep your data clean and your prompts sharp, and let the AI do the heavy lifting.
 zfn9
zfn9
