zfn9
zfn9
Python remains one of the most popular programming languages in the field of data analysis. Whether you’re just starting out or are already working as a data analyst, using the right libraries can significantly simplify your tasks. These libraries help you efficiently collect, clean, process, analyze, and visualize data. In this blog post, we’ll explore the top 10 Python libraries that are widely used for data analysis in 2025. These tools are powerful, user-friendly, and suitable for both beginners and experienced users.
1. Pandas
Pandas is often the first library that data analysts learn when starting with Python. It provides user-friendly tools for data manipulation and analysis. The main data structure in Pandas is the DataFrame, which is ideal for working with tabular data—similar to what you would find in an Excel file or database table.
With Pandas, analysts can:
- Import data from CSV, Excel, JSON, and SQL
- Clean and fill in missing values
- Group data and perform aggregations
- Merge, join, and reshape datasets
- Handle time series data
Tasks that might take hours in Excel can be completed in minutes with just a few lines of code using Pandas.
2. NumPy
NumPy is the foundational library for many other Python libraries, including Pandas and SciPy. It stands for “Numerical Python” and is primarily used to work with arrays. NumPy arrays are faster and more efficient than regular Python lists.
Key features of NumPy include:
- Support for multi-dimensional arrays
- Built-in functions for math and statistics
- Matrix operations for linear algebra
- Broadcasting, which simplifies operations on mismatched data shapes
Data analysts often use NumPy for fast, low-level operations on large datasets.
3. Matplotlib
Matplotlib is a classic charting library used to create simple yet powerful visualizations. Although newer libraries offer better default styles, Matplotlib remains important for its flexibility and control. With Matplotlib, analysts can:
- Create line, bar, and pie charts
- Customize labels, titles, legends, and colors
- Save plots as PNG, PDF, or SVG files
- Display plots inline in Jupyter Notebooks
For those seeking full control over every aspect of a plot, Matplotlib is an excellent choice.
4. Seaborn
Seaborn is built on top of Matplotlib but is easier to use and produces better-looking charts. It’s particularly useful for creating statistical visualizations and is often employed during exploratory data analysis.
Seaborn makes it simple to:
- Draw box plots, violin plots, and histograms
- Create heatmaps and correlation plots
- Plot relationships using scatter and line graphs
- Effortlessly handle categorical data
The charts created with Seaborn are both informative and visually appealing.
5. Plotly
Plotly is the go-to library for creating interactive and dynamic charts. Unlike Matplotlib and Seaborn, which create static images, Plotly allows users to zoom in, hover, and click on parts of the chart for more detail.
Key advantages of Plotly include:
- Interactive 2D and 3D charts
- Ability to build dashboards using Dash (another library from Plotly)
- High compatibility with web browsers
- Export to HTML for online sharing
Plotly is perfect for analysts who want to create engaging and accessible data visualizations.
6. SciPy
SciPy is a library used for scientific and technical computing, building on NumPy and adding more advanced mathematical functions. This library is beneficial for data analysts working in fields like engineering, physics, or finance.
With SciPy, users can:
- Solve equations and integrals
- Optimize functions
- Work with signal and image processing
- Perform advanced statistical analysis
SciPy is powerful for tackling complex calculations and large-scale numerical problems.
7. Scikit-learn
Scikit-learn is the top choice for machine learning in Python. While it is not strictly a data analysis tool, many data analysts use it to build models that predict outcomes or classify data.
Scikit-learn offers:
- Preprocessing tools for data cleaning and transformation
- Algorithms for regression, classification, and clustering
- Tools for model selection and tuning
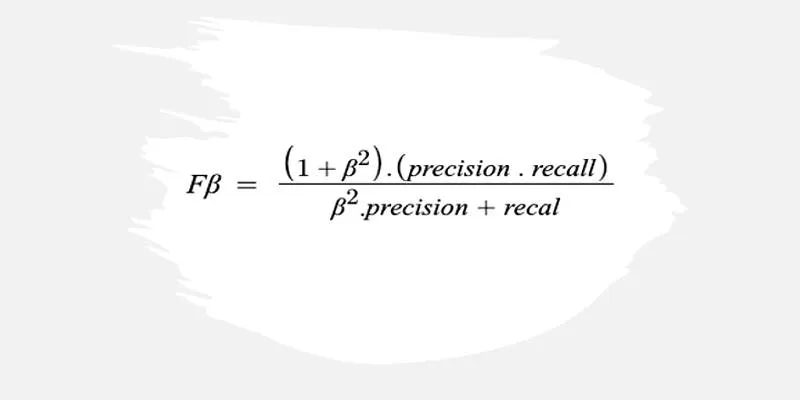
- Evaluation metrics like accuracy, precision, and recall
It’s beginner-friendly and supports nearly every common machine-learning method used in data projects.
8. Statsmodels
For traditional statistical analysis, Statsmodels is the preferred library. It provides methods for estimating and testing statistical models, with a strong emphasis on results interpretation. While Scikit-learn focuses on prediction, Statsmodels is about explanation.
Statsmodels provides:
- Linear and logistic regression models
- Time series forecasting tools (ARIMA, SARIMA, etc.)
- Statistical tests and diagnostics
- Detailed summaries with p-values, coefficients, and confidence intervals
Analysts in economics, healthcare, and social sciences often rely on Statsmodels for deep statistical insights.
9. OpenPyXL
OpenPyXL is a Python library that allows analysts to work with Excel files. Many businesses still use Excel in their workflows, and this tool helps bridge the gap between Python and Excel.
OpenPyXL enables users to:
- Read and write .xlsx files
- Update cell values, formulas, and styles
- Create and modify charts
- Automate tasks like report generation
Data analysts who need to share results with non-technical teams often use OpenPyXL to make the transition smoother.
10. Dask
When data is too large to fit into memory, Dask is the solution. Dask enables scalable computing by breaking large datasets into smaller chunks and processing them in parallel. Dask is designed to mimic Pandas, so it’s relatively easy to learn for those familiar with Pandas.
With Dask, analysts can:
- Handle big data without needing a high-end machine
- Speed up processing using multiple CPU cores
- Run computations on clusters or cloud systems
- Integrate with existing libraries like NumPy, Pandas, and Scikit-learn
It’s an essential tool for working with large datasets or in production environments.
Conclusion
In conclusion, mastering these top 10 Python libraries provides data analysts with a strong foundation to handle any data-related task. From cleaning and transforming data with Pandas to visualizing insights with Seaborn and Plotly, each tool offers unique advantages. Libraries like Scikit-learn and Statsmodels add predictive power and statistical depth to the workflow. For handling large datasets, Dask ensures scalability, while OpenPyXL bridges the gap with Excel. Together, these libraries make data analysis faster, smarter, and more efficient.