zfn9
zfn9
When building machine learning models, a key question is always present: how accurate is the model? The Mean Squared Error (MSE) is essential in answering this. It measures the discrepancy between predicted and actual outcomes by squaring the differences, thus emphasizing larger errors. This squaring step highlights major prediction issues that simpler metrics might miss.
In this article, we’ll dive into the definition and formula of MSE, explore its significance, and understand how it influences model accuracy across various machine-learning tasks. Understanding MSE is crucial for developing smarter, more reliable models.
What is Mean Squared Error?
Mean Squared Error is a standard loss function used in regression tasks. If you’re predicting a number—like the price of a house or tomorrow’s temperature—MSE helps you determine how far off your predictions are on average. The term “mean” refers to the average of errors, while “squared” indicates that each error is squared before averaging.
Here’s the definition and formula of Mean Squared Error:
In this equation:
- \( y_i \) is the actual value.
- \( \hat{y}_i \) is the predicted value.
- \( n \) is the total number of observations.
This formula calculates the squared differences between predicted and actual values, sums them up, and then divides by the number of observations to find the average squared error.
Why square the differences? Two key reasons: First, squaring ensures all errors are treated as positive values, focusing on the magnitude rather than direction. Second, it penalizes larger mistakes more heavily, guiding models to avoid significant errors.
Why is MSE So Widely Used?
You’ll find Mean Squared Error in everything from simple regression lines in spreadsheets to deep learning models in self-driving cars. Its popularity stems from two main features: it’s easy to compute and has mathematical properties that align well with optimization algorithms.

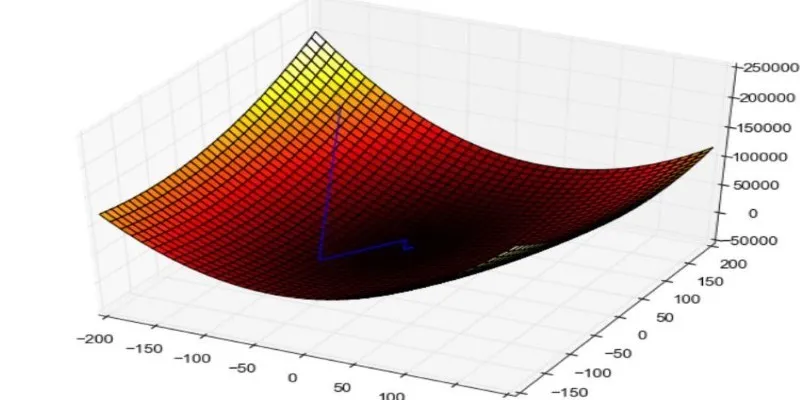
Many machine learning models are trained by minimizing a loss function—a value that measures model performance. Gradient descent, a common optimization method, works best with smooth and differentiable loss functions. MSE fits this description perfectly.
MSE’s sensitivity to large errors is another reason for its widespread use. In some scenarios, a few significant errors can be more detrimental than numerous minor ones. For instance, in earthquake risk prediction, a few wildly inaccurate predictions could have catastrophic consequences. MSE naturally highlights such outliers by amplifying their impact on the final score.
That said, MSE isn’t flawless. It may be overly influenced by a few large mistakes, especially in datasets with outliers or noisy labels. Nonetheless, in most controlled cases, MSE remains a reliable tool for performance evaluation, particularly when paired with its definition and formula.
MSE in Action: Real-World Examples
Let’s take this from theory to practice. Suppose you’re developing a model to predict house prices using features like square footage, bedroom count, and neighborhood. After training your regression model, you test it on new listings. For each house, the model predicts a price, which you compare to the actual sale price. Some predictions are close, while others miss the mark.
You compute the Mean Squared Error and get a result of 52,000. What does that mean? It represents the average of the squared differences between predicted and actual prices. Since it’s squared, the result is no longer in dollars, but it indicates the magnitude of typical errors in squared units. To contextualize it, you can take the square root to get the Root Mean Squared Error (RMSE), expressed in dollars.
Now, consider a weather forecasting system. Suppose it predicts a high of 72°F, but the actual temperature is 75°F. The squared error for that day is 9. Repeat this for 30 days, average the squared errors, and you get the MSE for that month. That single value shows how far off the model was, on average.
No matter the field—weather, real estate, finance—MSE remains a reliable metric for understanding prediction accuracy.
When (and When Not) to Use MSE

MSE excels in specific scenarios:
- The dataset is clean, with minimal outliers.
- Emphasis is on large errors rather than small ones.
- You’re optimizing a model with gradient-based algorithms.
However, it’s not always the best fit. For instance, in data with extreme outliers, MSE can be disproportionately affected. In such cases, alternatives like Mean Absolute Error (MAE) might be more suitable as MAE treats all errors equally, ignoring the square. MAE is more robust to noise but lacks some of MSE’s mathematical advantages.
There’s also a subjective aspect to choosing MSE: it depends on how your audience interprets errors. In a business setting, stakeholders might prefer metrics they can relate to. If MSE seems abstract, you might report RMSE or even MAE alongside it for a more relatable error metric.
Understanding what MSE is telling you and aligning it with your goals is crucial. Its definition and formula provide precision, but interpreting it in your context offers real insight.
Conclusion
Mean Squared Error is more than just a number—it’s a critical indicator of model performance. With its straightforward definition and formula, MSE offers a consistent way to measure prediction accuracy across different fields. While it emphasizes larger errors, making it valuable in many real-world cases, it’s also essential to interpret its meaning based on context. Used wisely, MSE helps guide model improvements and drives better decision-making through data.