zfn9
zfn9
Machine learning thrives on evaluation. Algorithms may appear sophisticated, but without proper measurement, they are nothing more than educated guesses. This is where performance metrics come into play, and one of the most crucial tools for assessing classification models is the ROC curve. Short for Receiver Operating Characteristic curve, this graphical representation helps understand how well a model distinguishes between different classes.
While accuracy might seem like the obvious measure of success, it often fails to tell the full story. A high accuracy score can be misleading if the dataset is imbalanced. The ROC curve provides deeper insight, helping data scientists make informed decisions.
Understanding the ROC Curve
At its core, the ROC curve illustrates the trade-off between two key measures of classification performance: the true positive rate (TPR) and the false positive rate (FPR). The true positive rate, or recall or sensitivity, is the fraction of positive instances correctly identified by the model. The false positive rate is the fraction of negative instances falsely identified as positive.
Various classification thresholds are utilized to plot an ROC curve. All models produce a probability score, and changing the decision threshold modifies sensitivity relative to specificity. A lower threshold will predict more positive cases, making true positives but also elevating false positives. A greater threshold does the converse and makes the model more conservative in prediction. By graphing different points that represent different thresholds, the ROC curve is born, creating a complete picture of the model’s performance.
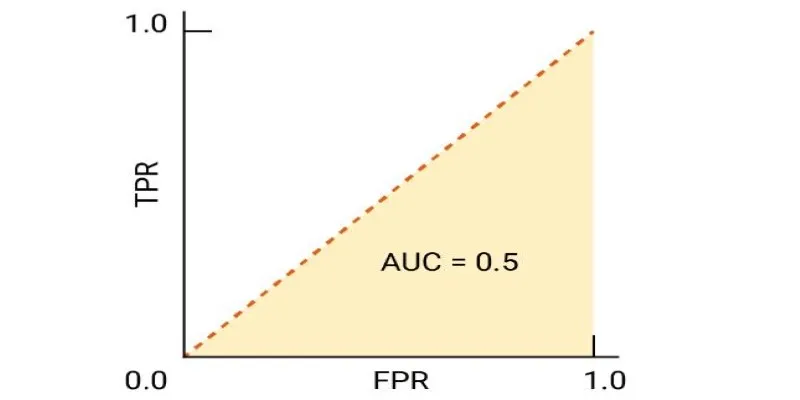
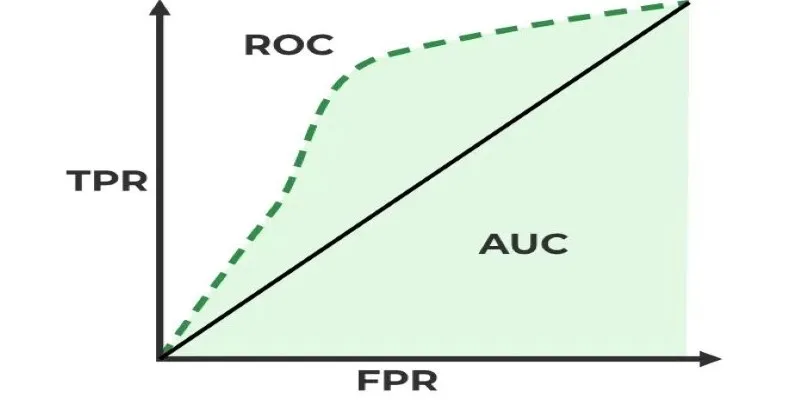
The form of the curve is important. An ideal classifier would have a curve that climbs steeply to the top left corner, showing high sensitivity with low false positives. A random classifier with no predictive ability would give a diagonal line, implying that the model is as good as guessing. The better the classification model, the closer the ROC curve is to the upper left corner.
The Importance of the AUC Score
The ROC curve is valuable, but its interpretation becomes even more straightforward with the Area Under the Curve (AUC) score. The AUC quantifies the overall performance of the classification model, providing a single value between 0 and 1. A model with an AUC of 0.5 suggests no discrimination capability, equivalent to random guessing. A model with an AUC close to 1 indicates strong classification power.
AUC helps compare models effectively. If one model has an AUC of 0.85 and another scores 0.72, the former is better at distinguishing between positive and negative cases. However, the interpretation should be context-dependent. For some applications, like medical diagnostics, even small improvements in AUC can be significant. A classifier used for fraud detection, for example, should prioritize minimizing false negatives, ensuring fraudulent transactions are not overlooked. In other cases, reducing false positives might be more important to avoid unnecessary interventions.
The AUC score also highlights the importance of choosing the right balance between sensitivity and specificity. A model might achieve a high sensitivity score but at the cost of generating too many false alarms. The ROC curve provides a complete picture, helping data scientists fine-tune their models based on real-world requirements.
Practical Applications of the ROC Curve
The ROC curve is more than just an academic tool—it plays a vital role in various industries where classification models are used. In healthcare, for example, it helps assess the effectiveness of diagnostic tests. A model predicting the presence of a disease must carefully balance sensitivity and specificity. Too many false positives could lead to unnecessary treatments, while too many false negatives could result in missed diagnoses. The ROC curve helps optimize this trade-off.
Similarly, in finance, fraud detection systems rely on classification models to identify suspicious transactions. A highly sensitive model might flag too many legitimate transactions as fraud, causing customer frustration. On the other hand, a model with low sensitivity might allow fraudulent activities to slip through. By analyzing the ROC curve, financial institutions can adjust their detection thresholds to minimize risk while maintaining customer satisfaction.
In machine learning competitions and model development, the ROC curve is widely used to compare classification algorithms. It provides a standardized way to assess models across different datasets. While other evaluation metrics like precision, recall, and F1-score are also useful, the ROC curve offers a holistic view of model performance, making it an essential tool in a data scientist’s arsenal.
Optimizing Model Performance Using the ROC Curve
The ROC curve is not just a tool for evaluation—it also helps refine and improve model performance. By examining how different classification thresholds affect sensitivity and specificity, data scientists can determine the most effective balance for a given application. In medical diagnostics, for instance, prioritizing sensitivity ensures that fewer cases go undetected, while in fraud detection, a balance must be struck to avoid excessive false alarms.
Adjusting the decision threshold is an essential step in model optimization. Lowering it may capture more true positives but can also increase false positives, while raising it makes predictions more conservative. The ROC curve helps visualize this trade-off, enabling informed decisions.
ROC analysis also benefits feature selection and algorithm comparison. If two models have similar AUC scores, choosing the simpler one improves efficiency without compromising accuracy. Similarly, models with higher AUC values generally perform better at classification, but practical factors such as interpretability and computational cost must also be considered. Ultimately, the ROC curve helps tailor machine learning models to real-world needs, ensuring optimal decision-making.
Conclusion
The ROC curve is an essential tool for evaluating classification models beyond simple accuracy. Illustrating the trade-off between sensitivity and specificity helps in fine-tuning model thresholds for better real-world performance. The AUC score simplifies comparisons, making it easier to identify strong models. Whether in healthcare, finance, or AI research, the ROC curve ensures reliable decision-making. Understanding its implications allows data scientists to optimize models effectively, striking the right balance between false positives and false negatives.