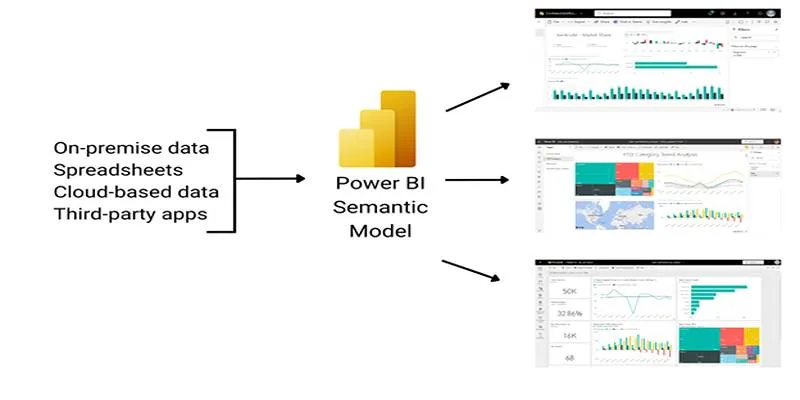
zfn9
zfn9
Power BI brings data to life, but without DAX (Data Analysis Expressions), it’s just charts and tables. DAX enables you to calculate, filter, and customize your reports with ease. While the language might seem daunting, most real-world dashboards rely on a select group of powerful functions. Mastering these essentials will help you unlock dynamic visuals, insightful metrics, and smarter data models.
In this article, we’ll explore the 10 most commonly used DAX functions in Power BI, breaking each one down in simple language so you can use them confidently, even if you’re not a formula expert.
Top 10 DAX Functions in Power BI
Let’s delve into these essential DAX functions in Power BI—these tools are at the core of most reports and enable deeper, more dynamic data insights.
CALCULATE: The Powerhouse of Context Change
CALCULATE is arguably the most critical DAX function. It’s not just about math; it’s about changing perspectives. CALCULATE evaluates an expression (like SUM or COUNT) but allows you to modify the context in which that expression runs. This means you can filter data dynamically. Want total sales only for last month or just for a specific product category? CALCULATE makes that happen. It’s typically combined with other functions, such as FILTER or ALL, to build dynamic calculations in reports and dashboards. Learning CALCULATE is like gaining the keys to the engine room of Power BI.
SUM: The Simple Workhorse
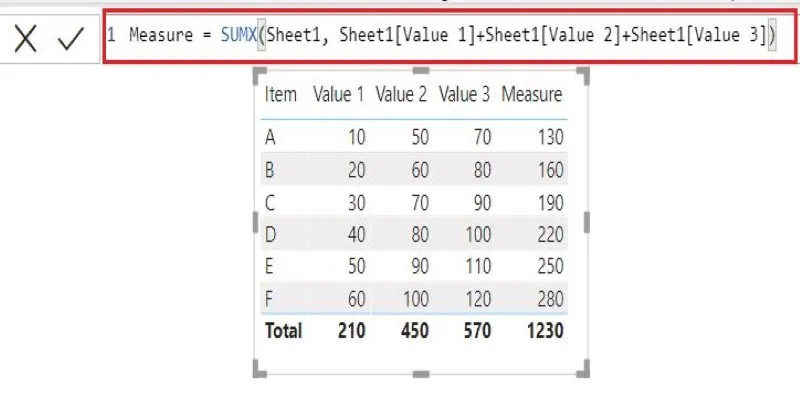
SUM is often the first DAX function anyone uses. It adds up all the values in a column, but its real power shows when combined with filters. For instance, using SUM inside CALCULATE helps you answer more specific questions like, “What’s the total revenue just from new customers this quarter?” The function may look basic, but it’s central to nearly every metric in a Power BI report.
FILTER: For Custom Slicing
FILTER allows you to manually define which rows should be included in a calculation. Unlike slicers or visual filters, this is done at the formula level. FILTER returns a table, making it commonly used inside CALCULATE to refine the data further. For example, if you want to filter rows where sales are above a certain threshold before totaling them, FILTER is the way to go. It provides fine-grained control over what data counts toward your KPIs.
ALL: Resetting the Filters
Sometimes, you need to calculate a value across all data, ignoring any current filters. That’s where ALL comes in. It removes filters from a column or table and is often used in percentage calculations. Say you want to show a product’s sales as a percentage of total sales, regardless of what’s selected in a slicer—ALL makes it possible. It’s the “clear the table” function when you want to zoom out.
DIVIDE: Safe Division with Grace
Anyone who’s ever dealt with division by zero errors knows the frustration. DIVIDE handles that by offering a third argument: the alternate result if the denominator is zero or blank. This makes it cleaner and safer than the standard division operator. Whether you’re calculating conversion rates, margins, or ROI, DIVIDE keeps things stable and readable.
IF: Making Logical Decisions
The IF function in DAX is a straightforward yet powerful tool for introducing logic into your calculations. Just like in Excel, it checks a condition and returns one value if true and another if false. This makes it ideal for labeling, flagging, or categorizing data based on specific criteria. For example, you can classify sales as “High” or “Low” depending on thresholds. IF is also frequently used in KPI dashboards to handle exceptions or highlight values that require attention, enhancing overall report clarity and usability.
RELATED: Jumping Between Tables
In data modeling, you’ll often work with multiple related tables. RELATED pulls a value from another table into the current row context. For example, if you’re analyzing sales data but need the product name from the product table, RELATED makes the connection seamless. It respects the relationships in your data model and allows for more expressive calculations.
DISTINCTCOUNT: Counting Uniquely
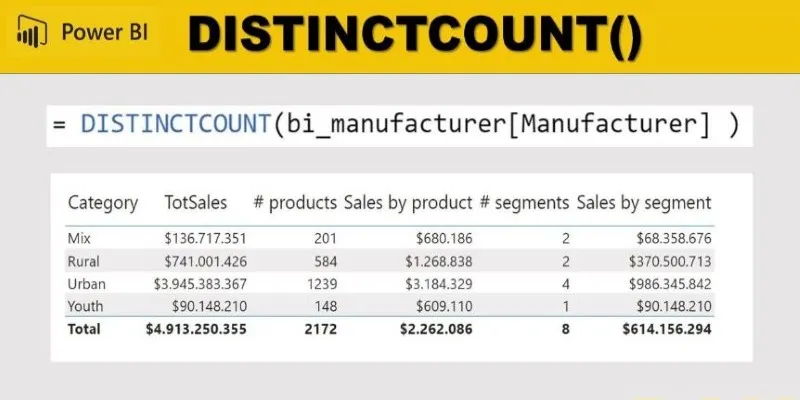
DISTINCTCOUNT gives you the number of unique values in a column. This is essential for metrics like the number of active customers, distinct products sold, or unique transactions. Unlike COUNT, it doesn’t inflate numbers with duplicates. It’s a must-have for accurate reporting, especially when understanding reach or engagement.
VALUES: Getting the Filtered List
VALUES returns a one-column table of distinct values. It’s often used when you want to compare the current filtered state of a report to the unfiltered data. For example, it’s helpful in dynamic titles, slicer-aware calculations, or custom aggregations. When used with functions like COUNTROWS or CALCULATE, it opens up flexible analytical possibilities.
SWITCH: The Elegant Alternative to Nested IFs
When you have multiple conditions to evaluate, IF can quickly get messy. SWITCH cleans that up. It acts like a cleaner version of multiple IF statements, making it easier to read and manage. You define an expression and map outcomes to expected values. It’s especially useful for creating custom categorizations or dashboards where labels shift based on business rules.
Conclusion
Mastering the 10 most commonly used DAX functions in Power BI is like upgrading your toolbox with tools you’ll reach for every day. These functions help you filter data precisely, calculate key metrics, handle exceptions, and work across related tables with ease. Whether you’re summing sales, counting customers, or tweaking context with CALCULATE, these functions simplify complex problems. You don’t need to learn all of DAX—just start with these core functions and build your confidence. Once these become second nature, the rest of Power BI becomes less about syntax and more about driving insights that truly matter.