zfn9
zfn9
Uncertainty shapes every major decision—whether you’re budgeting, investing, or planning a product launch. While intuition and research help, they don’t always prepare you for the full range of outcomes. Monte Carlo Simulation changes that. It uses randomness to simulate thousands of possible scenarios, offering a spectrum of likely results instead of a single guess. Originating in the 1940s, it’s become a trusted method for predictive modeling.
Best of all, you don’t need advanced software to use it. With just Excel, some formulas, and clear logic, you can run powerful simulations. This article breaks down how Monte Carlo Simulation in Excel helps make more informed, realistic decisions.
The Logic Behind Monte Carlo Simulation in Excel
Monte Carlo Simulation works by repeating random sampling to explore the range of possible outcomes for a given scenario. At the core of it is probability—rather than saying, “X will happen,” it asks, “What are all the things that could happen, and how likely is each one?”
Here’s a practical breakdown of how it works in Excel:
First, you start by defining the problem or the equation you want to model. This could be something as simple as estimating future profit or as complex as simulating investment returns over some time. You define the variables that influence the outcome and estimate the range of values each variable could take.
Once the model is set, Excel’s RAND() or NORMINV(RAND(), mean, std_dev) functions are used to randomly generate values for those variables. Each simulation or trial uses a new set of random values, generating a different outcome. You repeat this process hundreds or even thousands of times using Excel’s data tables or dragging formulas across rows. After that, the data is analyzed—averages, medians, confidence intervals, and histograms are generated to understand how your outcomes are distributed.
This approach to predictive modeling doesn’t just tell you what might happen. It shows you what’s likely to happen, how bad things could get, how good they could be, and how often different results occur. It’s a more realistic view of risk and opportunity because it accounts for randomness instead of assuming everything goes exactly as expected.
Setting Up a Monte Carlo Simulation in Excel: Step-by-Step
To make this more concrete, let’s say you’re forecasting potential monthly profits. You know your revenue varies between $8,000 and $12,000, and your expenses range from $5,000 to $7,000. The difference between the two gives you your profit. In reality, you don’t know exactly what revenue or expenses you’ll get each month—but you can simulate it.
In Excel, you’d set this up by assigning a cell to generate random revenue:
=RAND()*(12000-8000)+8000 — this gives a number between $8,000 and $12,000.
The same goes for expenses:
=RAND()*(7000-5000)+5000 — now you’ve got a random cost.
Subtract one from the other in a third cell to simulate profit.
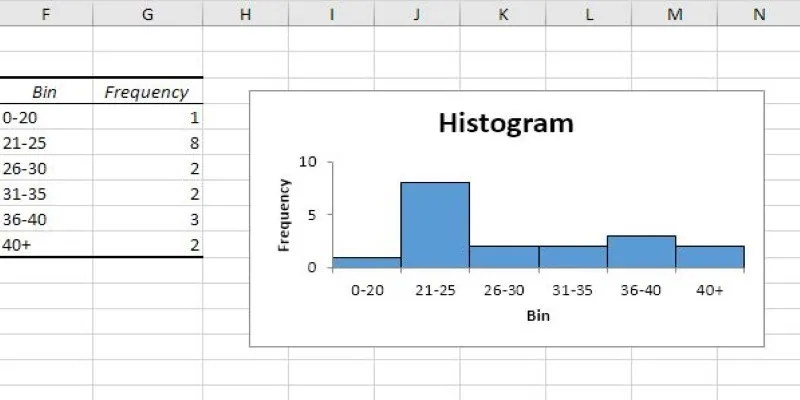
Now, instead of doing this just once, you replicate it across 1,000 rows. Each row represents a new simulation—essentially one possible version of the future. After filling all 1,000 simulations, you summarize the results: average profit, min, max, and standard deviation. You can even use Excel’s HISTOGRAM or FREQUENCY functions (or create a bar chart manually) to see the distribution of profit outcomes.
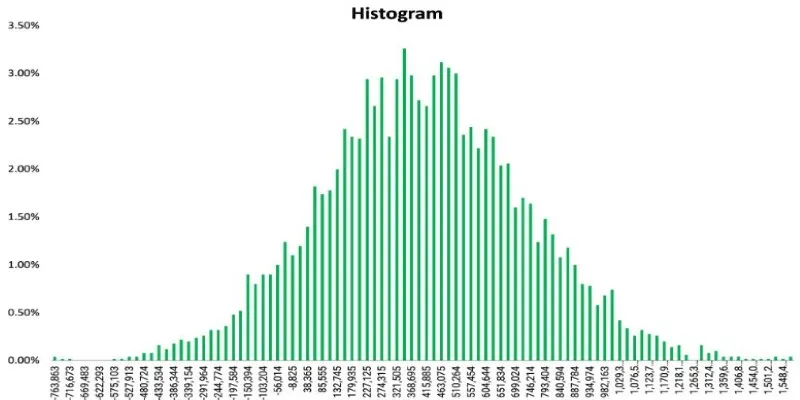
You can also simulate more complex models using a normal distribution with Excel’s NORMINV() or NORM.S.INV() functions. For example, if your revenue historically averages $10,000 with a standard deviation of $1,000, you could generate random values based on a bell curve. The formula:
=NORMINV(RAND(), 10000, 1000) — gives you a revenue value based on normal probability.
To automate this, you could use Excel’s Data Table feature. This allows one simulation formula to be recalculated many times, collecting all the results in a column with just one function, making the process smoother and easier to manage.
Why Use Monte Carlo Simulation in Excel for Predictive Modeling?
Monte Carlo Simulation in Excel is especially valuable for decision-making under uncertainty. It replaces static forecasting with a living model—one that adjusts for variation in input values and provides a full range of outcomes instead of a single guess. And because Excel is so widely used, it offers a low-barrier entry point for anyone interested in data-driven planning.
Take project management, for example. If you’re unsure how long different stages of a task will take, you can simulate task durations and get a better sense of overall timelines. Or, in financial modeling, if you’re estimating returns on a portfolio, you can simulate market performance over time and assess not just average return but also the risk of large losses.
In predictive modeling, this matters because real-life outcomes are rarely certain. Traditional formulas usually give a single answer based on fixed assumptions. Monte Carlo models, on the other hand, incorporate variability. Instead of assuming revenue will be $10,000, you admit that it could be anywhere between $8,000 and $12,000—and you see how that uncertainty affects everything else.
The result is clearer risk management, more reliable forecasting, and greater confidence in your decisions. Instead of relying on guesses, you’re embracing real-world uncertainty and using data to prepare for multiple outcomes, making your planning far more resilient.
Conclusion
Monte Carlo Simulation in Excel turns uncertainty into clarity. Instead of relying on fixed predictions, it gives you a full picture of what might happen—across thousands of possible outcomes. It’s simple to set up, doesn’t require advanced tools, and adds serious depth to your planning and forecasting. Whether you’re analyzing investments, project timelines, or business risks, this approach brings structure to unpredictable situations. You don’t need to predict the future with perfect accuracy—you just need to understand the range of what’s possible. With Monte Carlo Simulation in Excel, you make decisions not with blind hope but with realistic, data-backed confidence.