zfn9
zfn9
Cluster analysis is a fundamental technique in data science, pivotal for uncovering patterns and relationships within datasets. It plays a significant role in areas such as market segmentation, anomaly detection, and genetics. R, a powerful statistical computing language, offers robust tools for efficient clustering. By grouping similar data points, clustering enhances decision- making in various fields, including customer analytics and medical research.
Whether examining social trends or business metrics, implementing cluster analysis in R provides valuable insights. By using techniques like k-means or hierarchical clustering, raw data can be transformed into actionable patterns, leading to smarter strategies and deeper insights.
Understanding Cluster Analysis
Cluster analysis involves classifying similar data points based on specific characteristics. Unlike classification, which applies pre-existing labels, clustering is an unsupervised method that identifies natural groupings in data. This technique is especially beneficial for discovering underlying structures without prior knowledge of existing categories.
The most common clustering techniques include hierarchical clustering, k-means clustering, and density-based clustering. Each method excels under certain conditions and is selected based on the data type and analysis goal. For instance, k-means clustering is effective when the number of clusters is known, whereas hierarchical clustering offers more flexibility in uncovering group relationships. Density-based techniques like DBSCAN are excellent for detecting clusters of varying shapes and sizes.
Successful cluster analysis requires choosing appropriate similarity measures. Metrics such as Euclidean distance, Manhattan distance, or cosine similarity determine how data points are grouped. The quality of clustering depends significantly on selecting the right metric. Preprocessing data, including normalization and scaling, ensures unbiased clustering despite differing scales of numeric features.
Preparing Data for Cluster Analysis
Preparing the dataset is essential before conducting cluster analysis in R. Raw data often contains noise, missing values, or features on varying scales, which can skew clustering results. R offers various packages like dplyr, tidyverse, and cluster to clean and preprocess data effectively.
The first step involves loading a dataset, which can be imported into R using
the read.csv() function. Handling missing values involves strategies like
mean imputation or removing rows with excessive missing data. After cleaning
the dataset, standardization ensures that variables with larger numerical
ranges do not dominate the clustering algorithm, often achieved using the
scale() function in R.
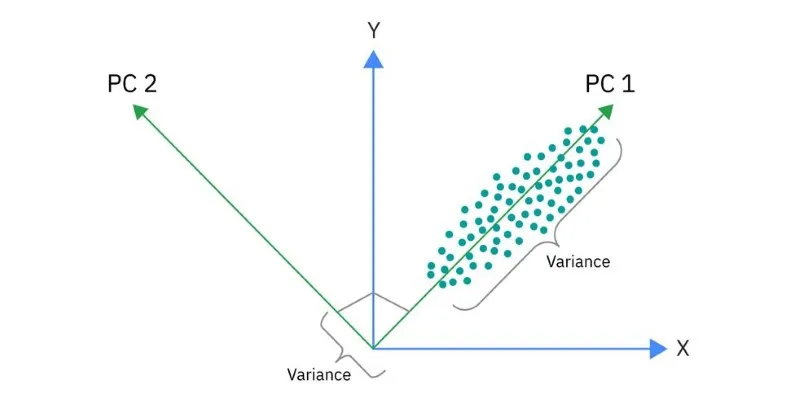
Principal Component Analysis (PCA) can also be used to reduce dimensionality
before clustering, enhancing performance and visualization. When dealing with
high-dimensional data, PCA extracts the most significant features, reducing
computation time. The prcomp() function in R simplifies this process, making
it easier to handle datasets with numerous variables.
Implementing Cluster Analysis in R
The choice of algorithm for cluster analysis in R depends on the dataset’s
nature. K-means clustering is one of the most widely used methods due to its
efficiency and simplicity. The kmeans() function in R partitions the data
into a specified number of clusters. Choosing the correct number of clusters
is crucial and is often determined using the elbow method, which involves
plotting the total within-cluster variation against the number of clusters and
selecting the point where the reduction in variation slows down. The
fviz_nbclust() function from the factoextra package provides a visual way to
find the optimal cluster number.
Another popular approach is hierarchical clustering, which does not require
specifying the number of clusters beforehand. Instead, it builds a tree-like
structure known as a dendrogram to represent relationships among data points.
The hclust() function in R is used for hierarchical clustering, and
different linkage methods, like complete, single, and average linkage,
influence the final cluster structure. Once clustering is completed,
cutree() is used to extract the desired number of clusters.
DBSCAN is preferred for datasets with noise or varying densities. Unlike
k-means or hierarchical clustering, DBSCAN does not require specifying the
number of clusters in advance. It uses a density-based approach to identify
clusters. The dbscan() function from the dbscan package in R is used for
this method. DBSCAN effectively identifies clusters of different shapes but
requires a careful selection of parameters like eps, which controls
neighborhood size.
After clustering, evaluating cluster quality is essential. Silhouette analysis
measures how well data points fit within their assigned clusters. The
silhouette() function in R helps assess the effectiveness of clustering. A
higher silhouette score indicates well-defined clusters, while lower scores
suggest overlapping or poorly separated groups.
Interpreting and Visualizing Clusters
After performing clustering, understanding the results through visualization is crucial. R provides several tools for visualizing clusters. Scatter plots using ggplot2 can display clustered data in two-dimensional space. For datasets with more than two variables, factoextra and ggplot2 help create PCA- based visualizations to better interpret cluster structures.
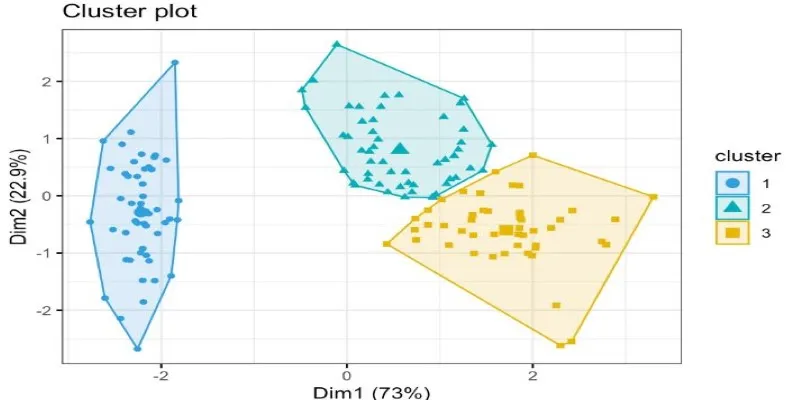
Heatmaps offer another way to observe clustering results, particularly for
hierarchical clustering. The heatmap() function in R provides an intuitive
representation of how data points relate within clusters. Cluster centers and
distributions can also be analyzed using box plots to understand variations
within each group.
For business or research applications, interpreting clusters involves identifying common characteristics among grouped data points. In customer segmentation, for example, clusters may reveal purchasing behaviors or preferences. In healthcare, clustering can help identify patient groups with similar medical conditions, aiding in targeted treatments.
Conclusion
Making sense of complex data is challenging, but cluster analysis in R simplifies the process by identifying natural groupings. Whether using k-means for quick segmentation, hierarchical clustering for deeper insights, or DBSCAN for handling noisy data, the right approach depends on the dataset’s structure. Proper preprocessing and careful evaluation ensure that clusters are meaningful and useful. Visualization techniques like scatter plots and heatmaps bring clarity to the results, making analysis more intuitive. With R’s robust clustering tools, anyone dealing with data—from businesses to researchers—can extract valuable insights, leading to smarter decisions and a clearer understanding of patterns.